An examiner spends less than five minutes grading a 250-word UPSC Mains answer. In those few minutes, their eyes hunt for keywords, structure, and clarity. Research in cognitive load theory suggests that the human brain processes visuals 60,000 times faster than text. Using a well-placed flowchart or map acts as a “speed-reader” for the evaluator. It signals that you understand the core demand of the question without making them wade through a sea of ink.
The 7-Minute Challenge: Why Visuals Matter
In the Mains exam, you have roughly seven to nine minutes to plan and write an answer. Writing 200 words of pure prose is physically taxing and time-consuming. Diagrams allow you to “dump” complex information quickly. They break the monotony of long paragraphs and provide a visual “hook” that can elevate a 4-mark answer to a 5.5-mark answer.
Subject-Specific Visual Tools
Different subjects require different types of visual representation. You cannot use a Geography map style for an Ethics case study.
| GS Paper | Subject | Recommended Visual Tool |
| GS I | Geography | Directional maps, cross-sections, and cycles (e.g., Water Cycle). |
| GS I | History | Timeline of events, architectural floor plans (temple styles). |
| GS II | Polity | Circular diagrams for “Checks and Balances,” flowcharts for Bill passage. |
| GS III | Economy | Trend lines (GDP growth), supply-chain flowcharts, Hub-and-Spoke models. |
| GS III | Environment | Food webs, energy pyramids, and Venn diagrams for biodiversity. |
| GS IV | Ethics | Stakeholder maps and value-conflict triangles. |
The Anatomy of a High-Scoring Diagram
A messy scribble is worse than no diagram at all. Your visual aids must be functional. They should clarify your point, not confuse the reader.
- Proximity: Always place the diagram near the text it explains. Do not force the examiner to flip the page to find the reference.
- The Box Rule: Always enclose your diagram in a neat, thin-lined box. This separates the visual from your handwriting and looks professional.
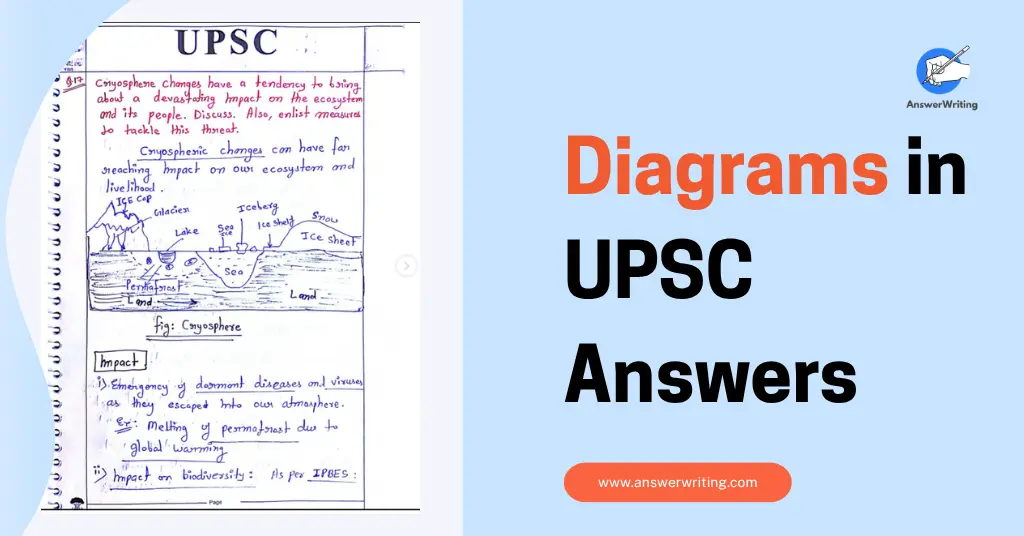
- The Title: Give every diagram a caption. For example: “Figure 1: Evolution of Buddhist Architecture.”
- Labeling: Use block letters for labels. Use straight lines (pointers) to connect the label to the specific part of the drawing.
Flowcharts for Process and Governance
GS-II and GS-III often deal with processes, hierarchy, and cause-effect relationships. Instead of writing “The Cabinet approves the bill, then it goes to the Lok Sabha,” use a linear flowchart.
For governance topics like “Digital India,” a “Hub and Spoke” model works best. Put the main theme in a central circle and draw “spokes” outward to various sectors like Education, Health, and Infrastructure. This shows the breadth of your knowledge in a single glance.
The Geography Advantage: Maps and Spatial Data
In Geography, a map is not an “add-on” (it is often mandatory). You do not need a perfect artistic representation of India or the World. You need a recognizable outline that shows spatial relationships.
If the question is about “Resource Distribution,” a rough map of India with shaded regions for coal or iron ore is more effective than a two-page description. Similarly, for International Relations (GS-II), a small map showing the “String of Pearls” or “IBEC Corridor” demonstrates a deep geographical understanding of geopolitics.
The Ethics “Hub”: Visualizing Case Studies
In GS-IV, students often struggle with long-winded introductions. A “Stakeholder Map” is the most efficient way to start a case study.
- Identify the central dilemma.
- Draw a central circle representing the issue.
- Draw branches to every person or group affected (Government, Local Public, Environment, Family).
- Mention the specific ethical value involved (Integrity, Compassion, Accountability) next to each stakeholder.
Practical Workflow: How to Practice
Diagrams should not be a “surprise” you try for the first time in the exam hall. They must be part of your daily note-making. When reading the newspaper, try to convert a complex editorial into a one-page mind map.
Many aspirants find that while they can draw a map in 2 minutes at home, they freeze during the actual test. This is why feedback is vital. Services like AnswerWriting.com allow you to upload your handwritten practice sheets. This helps you see if your diagrams are legible and if they actually add value to the specific question asked. Teachers can then guide you on whether a flowchart was better suited than a paragraph for that specific context.
Common Pitfalls to Avoid
- Over-crowding: Do not try to fit 20 labels into a small 2-inch box. Keep it “breathable.”
- Irrelevance: Never draw a diagram just because you know how to. If it doesn’t answer the question, it’s a waste of time.
- Color Pens: Stick to your regular blue or black pen. Changing pens mid-answer wastes precious seconds. Use the same pen for drawing and writing.
- Pencil vs. Pen: Do not use a pencil. Pencil marks can smudge and appear light after the answer sheets are scanned for evaluation. Use a pen for sharp, high-contrast visuals.
Frequently Asked Questions (FAQs)
1. Is it okay to use a pencil for diagrams in UPSC Mains?
It is generally discouraged. Answer sheets are often scanned digitally for evaluators. Pencil marks can be faint or smudge during the scanning process. Use the same pen you are using for your text to save time and ensure clarity.
2. Should I draw the diagram before or after writing the text?
It depends on the space. If the diagram is central to your answer, draw it immediately after the introduction. This helps you use the diagram as a “skeleton” for the rest of your points.
3. How much time should I spend on a single flowchart?
A flowchart should take no more than 45 to 60 seconds. A map of India should take about 30 seconds. If it takes longer, you need more “muscle memory” practice.
4. What if I am not good at drawing?
UPSC is not an art competition. As long as your diagram is neat, labeled, and logically correct, you will get marks. Simple boxes, circles, and arrows are usually sufficient.
5. Can I use diagrams in the Essay paper?
Generally, no. Essays are expected to be a continuous flow of prose and literary expression. Diagrams can break the “rhythm” of an essay. Keep the visuals strictly for the GS papers and Optionals.